*Note: all screenshots are posted on the bottom of the articles.
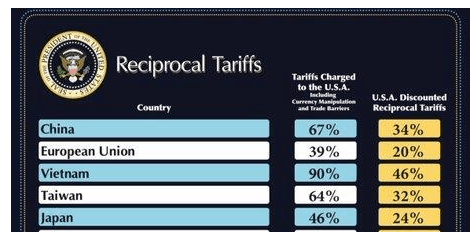
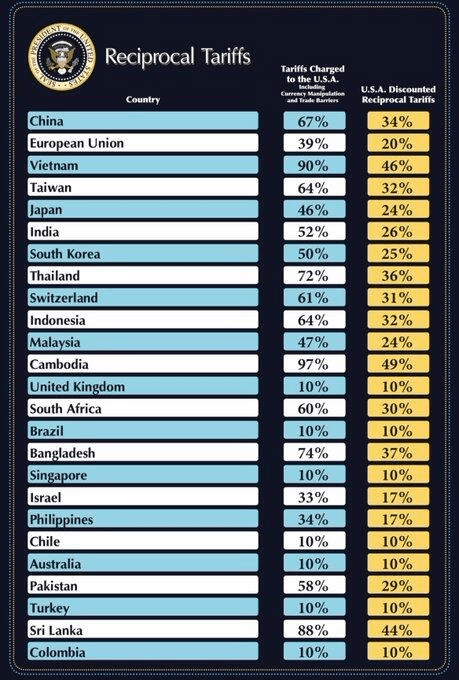
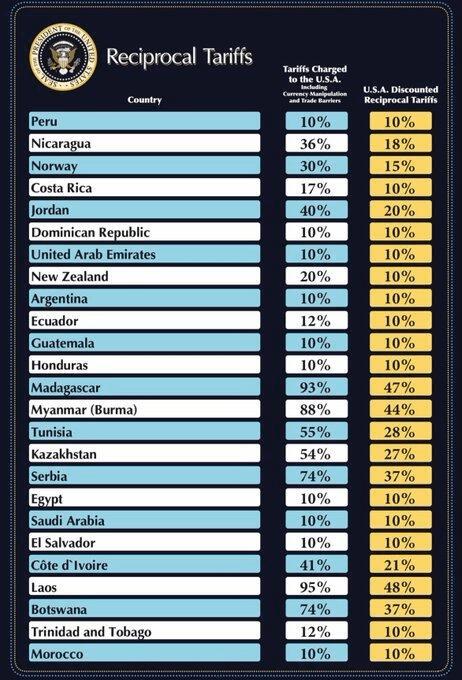
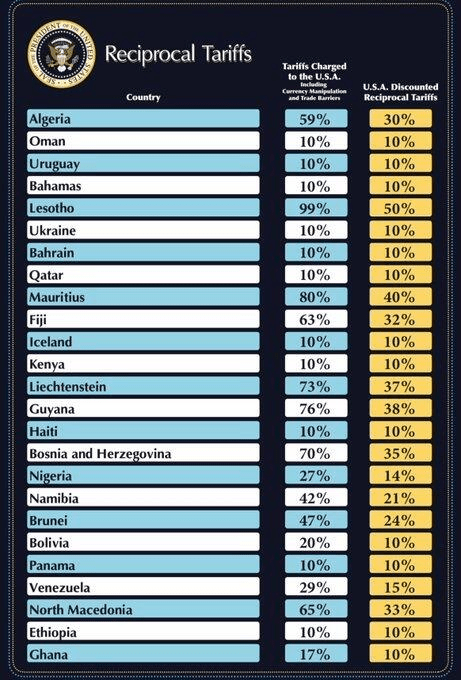
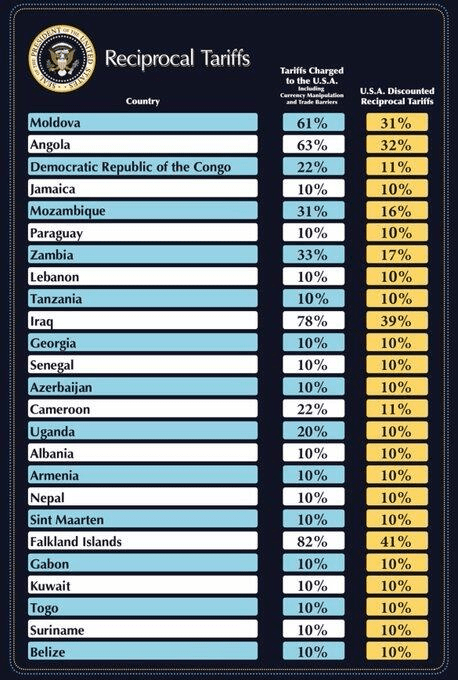
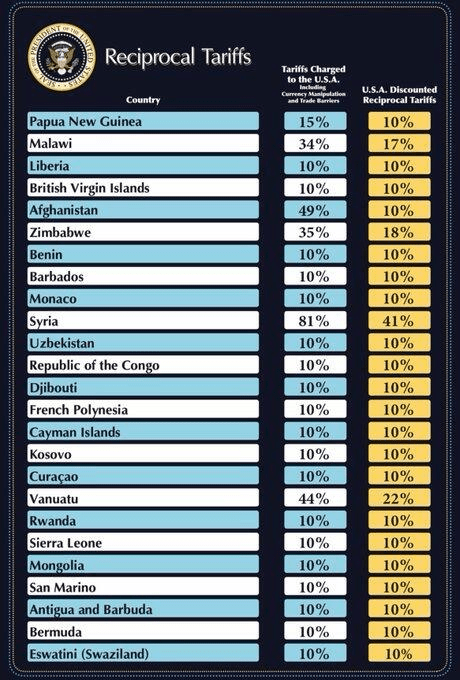
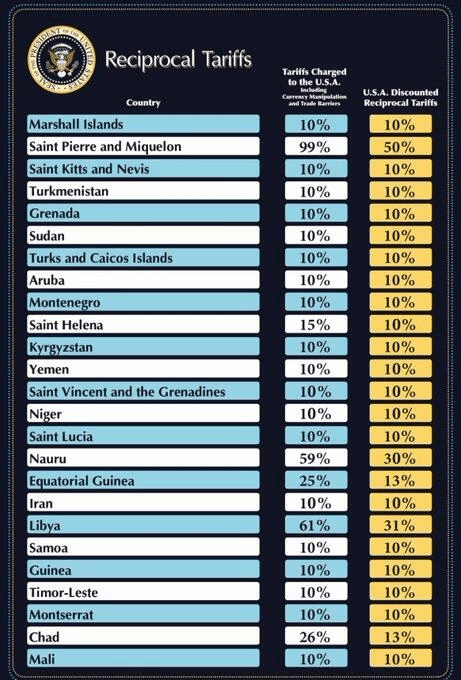
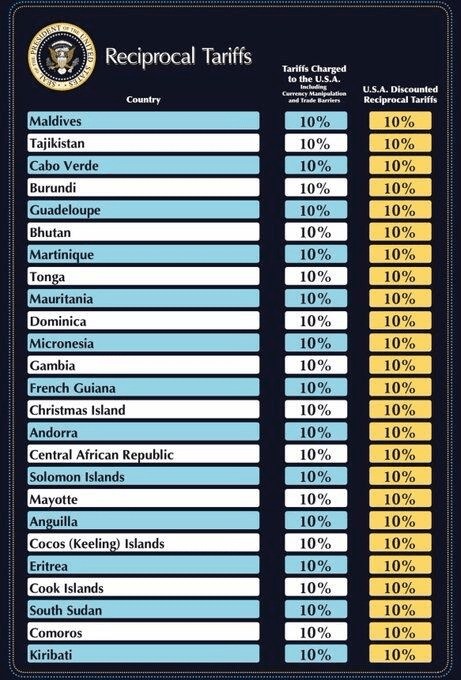
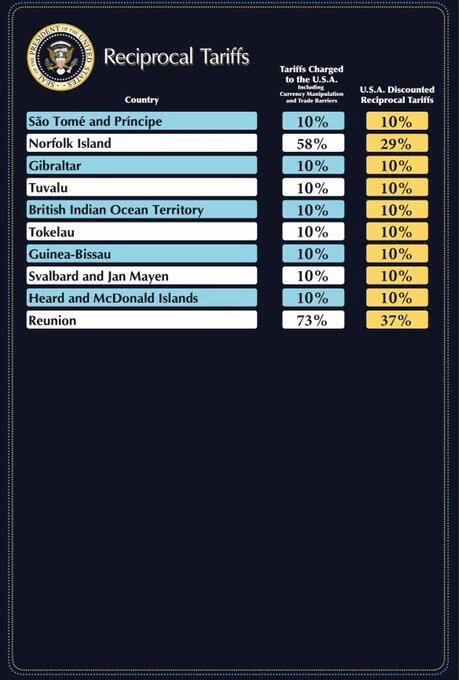
When Trump unveiled his tariffs on various countries, I focused heavily on one question: where in the **** did he get the values in the blue and white column? None of the values seem to align with actual tariffs. I’ll use Japan as an example. You can see the full list at the bottom of this article.
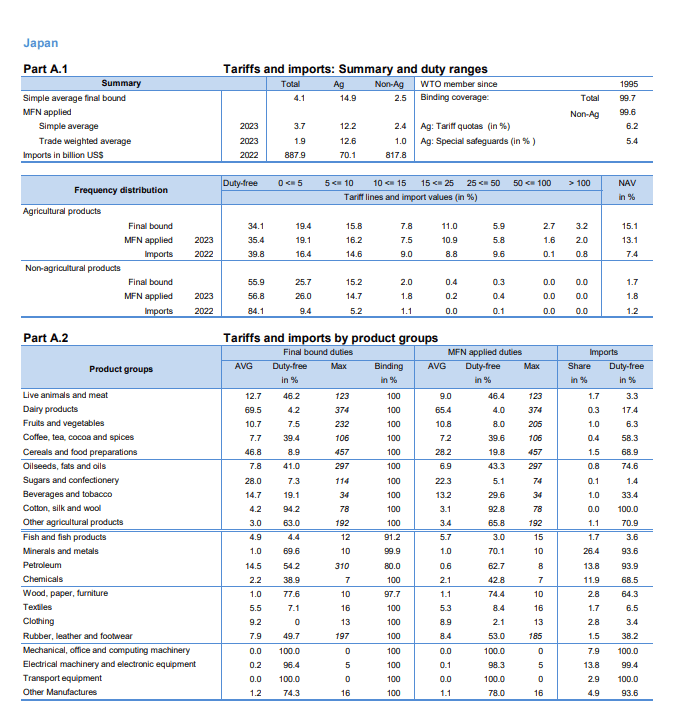
Below is a screenshot from the World Trade Organization’s report card on their active tariffs. You can get to the link here: https://www.wto.org/english/res_e/statis_e/daily_update_e/tariff_profiles/jp_e.pdf
According to WTO data, the simple average tariff imposed on trade by Japan was 4.1%. I’m not entirely sure I’m looking at the right data point, but I can be reasonably certain that their actual tariff rate is far below 20%. However, if we look at Trump’s chart, we see that he claims Japan’s rate is 46%. So, again, where does this value come from?
I found a comment on Reddit that explains it very well:
If we go to the link for the USTR, we can pull up the data from Japan. Here is what the USTR says:
“U.S. goods trade with Japan totaled an estimated $227.9 billion in 2024. U.S. goods exports to Japan in 2024 were $79.7 billion, up 5.4 percent ($4.1 billion) from 2023. U.S. goods imports from Japan totaled $148.2 billion in 2024, up 0.7 percent ($971 million) from 2023. The U.S. goods trade deficit with Japan was $68.5 billion in 2024, a 4.3 percent decrease ($3.1 billion) over 2023”
The math goes like this: (1 – (exports/imports)). After applying for Japan, your formula becomes (1 minus (79.7/148.2)). The result of that value is 0.4622, which comes out to the tariff value that Trump uses. It’s bad economics, and there’s no way to sugarcoat it: it’s stupid.
But, you know what, let’s do Taiwan as well. From the USTR site:
U.S. total goods trade with Taiwan were an estimated $158.6 billion in 2024. U.S. goods exports to Taiwan in 2024 totaled $42.3 billion, up 6.0 percent ($2.4 billion) from 2023. U.S. goods imports from Taiwan in 2024 totaled $116.3 billion, up 32.5 percent ($28.5 billion) from 2023. The U.S. goods trade deficit with Taiwan was $73.9 billion in 2024, a 54.6 percent increase ($26.1 billion) over 2023.
The formula becomes: (1 minus (42.3 / 116.3)). Guess what that value equals… 63.629, or 64%
EXHIBITS below:

Leave a reply to Trump Dumb Cancel reply